Is there a view grander than this?
We speak of evolution in the history of Earth, of the millions of years, of entire groups of living beings waxing and waning, but our view on the actual timeline has always been tragically blurry. Deep time does not let things escape its clutch with ease. Fossils are always few and far between, and we can never be certain of having sampled everything. If we see a fossil species popping out, say, 400 millions of years ago, who’s to say it was not there 450 millions of years ago too, but we didn’t find it? If we see it dying 300 millions of years ago, who’s to say it didn’t survive somewhere undocumented? (The formal term for all this is the Signor-Lipps effect) That is what happened to the coelacanth, for example: considered dead for 66 millions of years, until Marjorie Courtney-Latimer found a fresh one in a fish market.
But we slowly have more and more data, and we have more and more computer power to devise their meaning from sophisticated probabilistic model. That is what the breathtaking paper from Jun-xuan Fan et al. published on Science is all about. Using a huge amount of data on marine fossils from Chinese strata, spanning from 538.85 (Early Cambrian) up to 244.41 (Early Triassic), and processing it on one of the most powerful Chinese supercomputers, the Tianhe II, they managed to chart the rise and fall of marine biodiversity (pardon: marine mostly animal biodiversity: as usual non-animal groups are forgotten, fusulinids being an exception) in the Paleozoic, with a time resolution of about 26.000 years. Limiting to China is not a problem as big as it seems: today’s China is a puzzle of geological units that once span from North to South pole, all around the world.
It might seem that a resolution of 26.000 years is fuzzy -a ‘pixel’ of their timeline is almost four times longer than the history of civilization- but it’s geological time we are talking here. A span of 294 millions of years, the most recent 244.41 millions of years ago. Split into 11326 intervals. This is truly high resolution, and the result is magnificent.
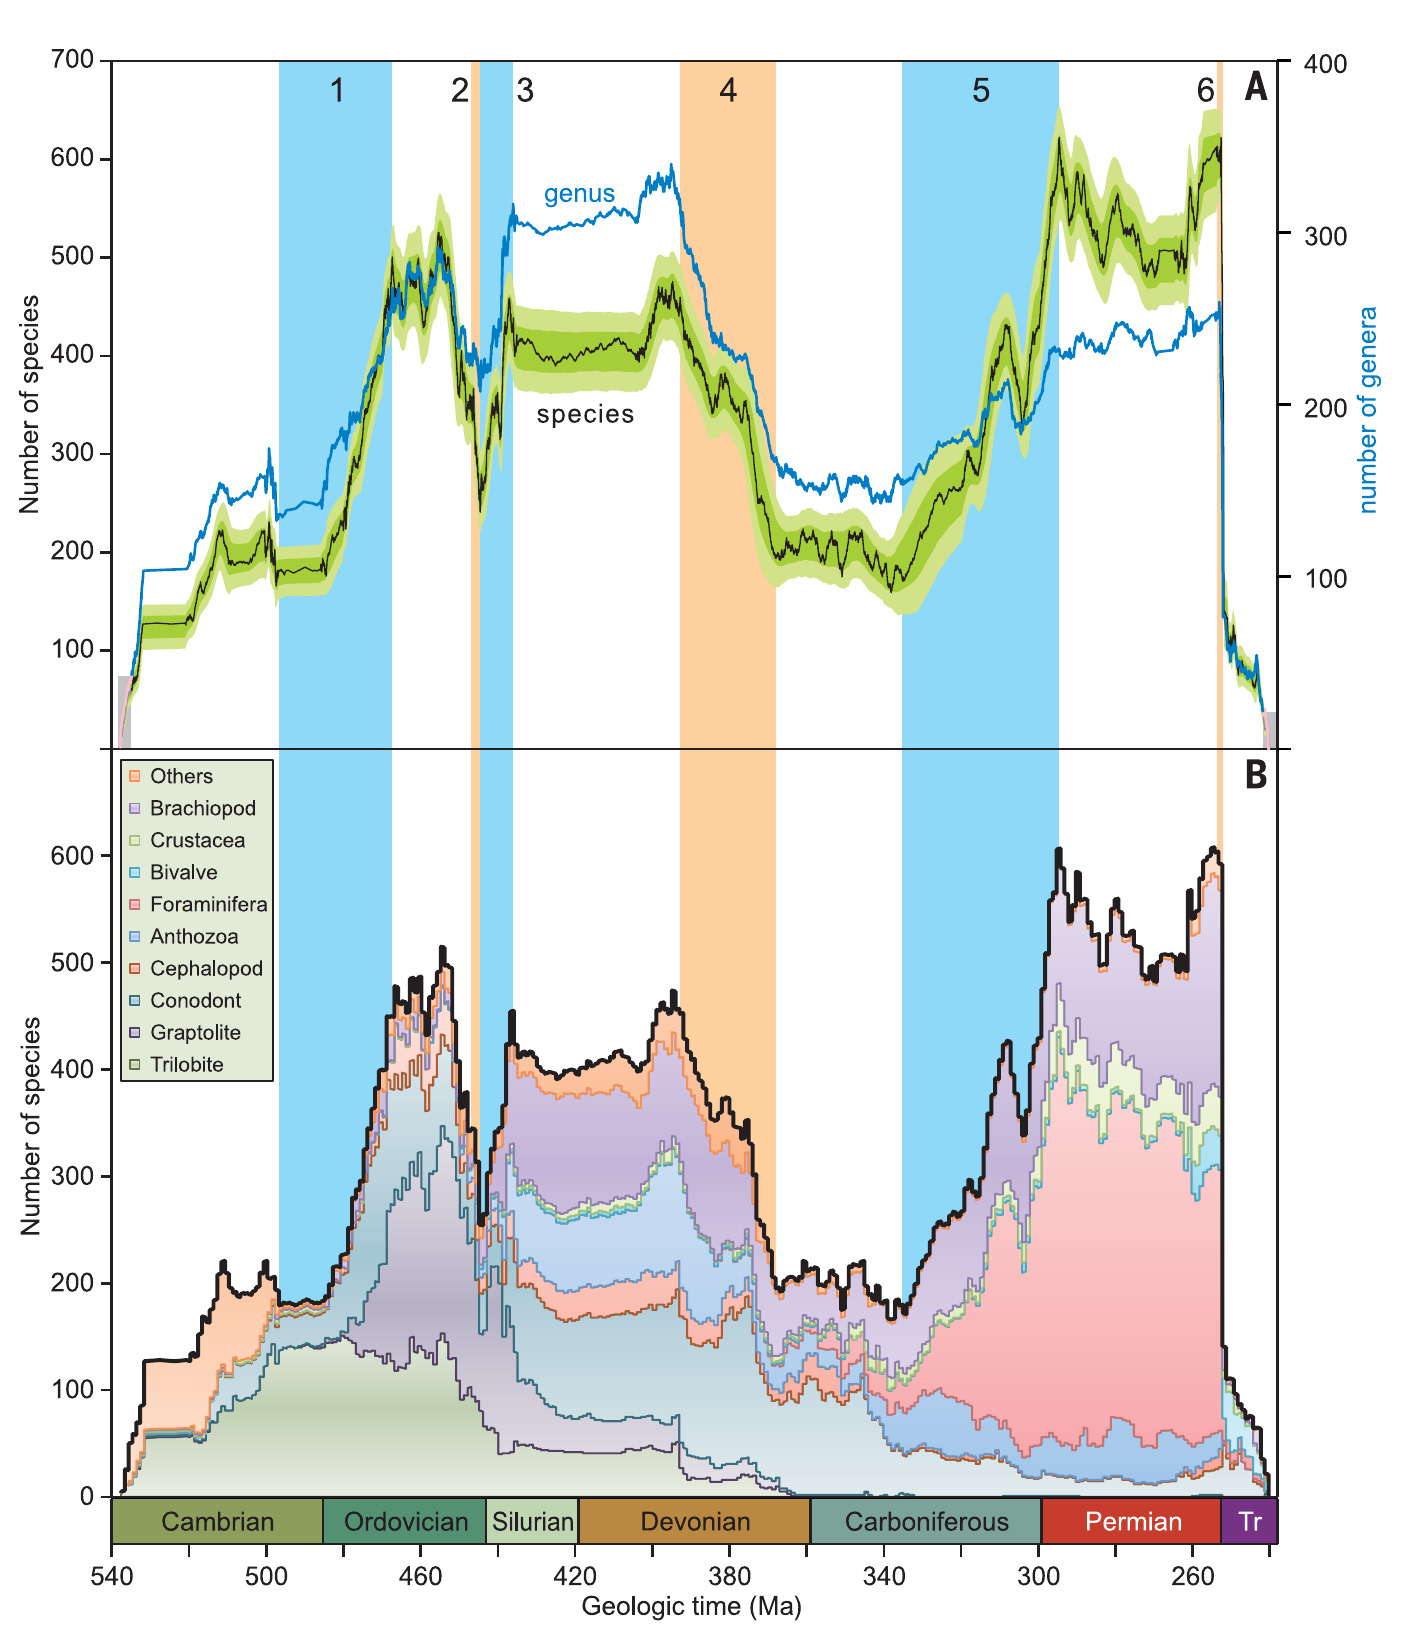
Look at the image above. On top you see the global genus and species biodiversity (note the two different scales left and right), on the bottom the number of species split into different taxonomic categories. The coloured time intervals are 1, Great Ordovician Biodiversification Event; 2, end-Ordovican mass extinction; 3, early Silurian radiation; 4, Middle to Late Devonian diversity decline; 5, late Carboniferous–early Permian biodiversification event; 6, end-Permian mass extinction.
Extinctions happen on all variety of timescales. One plot, and we can finally end forever the war between ‘instant mass extinction’ catastrophism and Lyellian gradualism. There is, simply, a spectrum of all timescales. The razor-sharp vertical cliff at the end of Permian is clearly visible: in a few tens of thousands years, life on Earth was all but wiped out. On the other hand, in the Devonian the number of animal species halved slowly but steadily between about 400 to 370 millions of years ago, and only started to recover about 330 millions of years ago. Is that a mass extinction, only as long as the time interval separating us from the dinosaurs? How do we conceptualize this sluggish but constant loss of biological diversity? Recovery events are also variable: sometimes biodiversity immediately bounces after a decline, sometimes there are millions of years of stasis before life diversifies again.
It is also interesting to my former-scientist eye how many phenomena we believed in, such as the end-Guadalupian extinction, could have been nothing more than artifacts. Past charts of biodiversity history were much more coarse grained, and counted genera and families into million years-long bins. A poorly appreciated fact is that lowering the resolution does not only hide details, it also creates false details, by lumping and restructuring the information. The illusory canals on Mars appeared to XIX-early XX century observers due exactly to that.
We often imagine paleontology as a single-fossil discipline. One digs and finds an Archaeopteryx, a Sinosauropteryx, a Taung Child, a Hallucigenia, a key set of bones and stones that makes or breaks an evolutionary hypothesis. Sometimes it is true, but to appreciate the river of life, one must look beyond the individual drops that make it. Palaeontology is a lot about statistics, and it is amazing how the progress in searching, cataloging and analyzing big data on past biodiversity is yielding a picture of our complex past.
Ernst Rutherford (maybe) said that science is either physics or stamp collecting. I hope it was just a silly joke; a stupider take on science is hard to find. Here we see the epitome of stamp collecting: thousands of shells, traces on rocks, legs, bones being lovingly removed from their hundred-of-million-years graves, described and pinpointed on the history of life. The result is nothing less than the irregular heartbeat of the tides of life, the endless tree of forms growing and wilting, under ever diverse, endless forces, in a time incomprehensibly long and remote, and yet no less real.
The paper is: Fan, Jun-Xuan et al. A high-resolution summary of Cambrian to Early Triassic marine invertebrate biodiversity Science, 17 Jan 2020 : 272-277
(Also read the Perspectives on Science and Nature)