Darwin of a billion years

Is there any chance of predicting the history of life? On the footsteps of Gould, that would seem a foolish quest. Rewind the tape and replay it, he said, and you will see a different movie every time: infinite possible worlds lost in the tiniest of chances. And yet it is all too tempting to search for general rules, and sometimes we are rewarded. What if we could predict what creatures can survive multiple extinctions, on the scale of half a billion years?

This apparently absurd proposition is what a recent study by Matthew L. Knope, Jonathan L. Payne et al. has shown at the end of this year’s February. They analyze a huge amount of living and fossil marine genera -30,074 and 19,992 respectively, another proof of the power of big data when dealing with the history of life- and try to correlate the taxonomic diversity to the ecological diversity over time. That is, the number of species of a clade versus the ecological strategies exploited by members of that clade.

One could find it obvious that there is some correlation -after all, if you have lots of genera, you can imagine there are more chances they evolved to different niches- but it is not necessarily always so. And this is the main finding of Knope et al.: this correlation evolves over geological time.

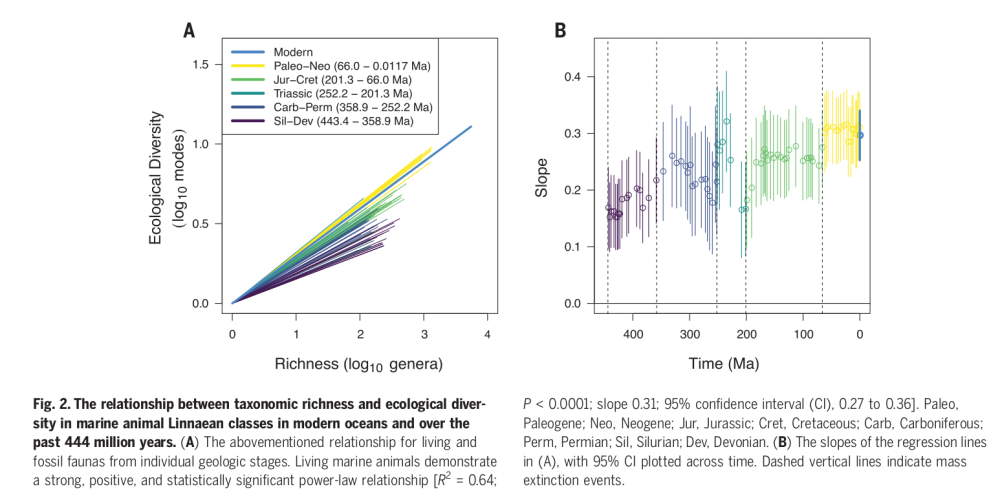
The graph on the left shows the (log-log) correlations between the richness of genera on the x axis and the ecological diversity on the y axis, divided by geological period. The “rays” must be interpreted dynamically. The dark lines laying low are the correlation as it were in the Paleozoic, starting from the Silurian and Devonian. Going forward the correlation shifts: turquoise and green lines, corresponding to the Mesozoic, grow steeper, until in the Tertiary -yellow lines- it becomes almost double than the Paleozoic one. In other words, the more you go forward in time, the more ecological diversity correlates with taxonomic diversity.

Now, this is nice but hard to interpret. Now see the graph on the right: the slopes of the lines on the left are plotted against time. You can see the vertical dashed lines separating mass extinctions. It is not always convincing, but there is some hint that mass extinctions did something. After each extinction, ecological diversity becomes more tightly related to taxonomic ones.

What is going on? We are seeing how extinctions shape the composition of life on the scale of the Phanerozoic. It is not that ecologically diverse clades are better at diversifying and evolving: actually what they find is that, at least in the Tertiary, they diversify less than ecologically poor clades. Each ecological crisis instead tends to wipe out clades that were not flexible enough, forced to live within a few ecological modes. Clades that instead could exploit more ecological niches were able to find at least some of their members surviving a crisis. They diversify and repopulate the oceans for the simple reason they are the ones surviving, and they survive because they have the strategies to do so.

The classes that had high taxonomic richness and low ecological differentiation during the Paleozoic, such as rhychonelliform brachiopods and crinoids, consisted largely or entirely of nonmotile suspension feeders that mostly cannot occupy infaunal or pelagic habitat tiers. In contrast, the classes and phyla that are genus-rich in the Cenozoic (e.g., mollusks, arthropods, and vertebrates) are generally motile, feed in a variety of ways, live across many habitat tiers, have more control over gas exchange with the environment, and have weathered mass extinctions well.

Let’s take it in what this means. First, this means that we have some hope of predicting what animals groups would survive extinction better than others. Animals who are more motile, more versatile, that exploit more environments and more strategies will have better changes. Brachiopods were dominant in the Paleozoic, but a glance at their physiology compared to that of bivalves, in hindsight, shows us they didn’t have a chance. They were simply too rigidly adapted to a single mode of life to fare well after a catastrophe such as the end-Permian.

Second: Our seas are not different from the ones of the Paleozoic just because we have different animals. Our ecosystems have been selected. The animals we have today in the sea are quicker, more mobile, smarter at exploiting different niches, have better metabolisms – and they are like that because they are the hardened survivors of multiple ecological crises. As Knope explains:

The oceans we see today are filled with a dizzying array of species in groups like fishes, arthropods, and mollusks, not because they had higher origination rates than groups that are less common, but because they had lower extinction rates over very long intervals of time.

We are seeing natural selection acting not on the scale of the individual or of the species: we are seeing it acting on entire ecosystems on the scale of half a billion years. Knope et al. show that the shadow of Darwin is longer than we imagined, as long as the tape of Gould, shaping not only single species but the entire composition of life along hundreds of millions of years.

Paper: Knope et al., “Ecologically diverse clades dominate the oceans via extinction resistance“, Science 367, 1035–1038 (2020)

Songs of the rising sun: I

It is particularly poignant, now that we are in the middle of the covid crisis (that also stopped this blog), to reflect on what happens after the catastrophe. We have no idea of what we world we live will be, only that it will be different, that we will miss the past, that we will see something new unfold.

The same holds for mass extinctions. I’m working on a feature on extinction recovery, something I curiously forgot discussing when writing my book, and so I will drop some reading notes here. As it often happens, one misses the best papers right after publishing something, and I don’t know how I managed to miss the brilliant review by Pincelli Hull on life in the aftermath of mass extinctions. I mean, just the sentence “Rather than a plodding tortoise, extinction is a hare – racing in fits and starts” would have been perfect in my book. Oh well, it’s never too late.

The first point of Hull is that extinction recovery and species radiation takes place in a strange world. The world right after Chicxulub or after the Permian is not business as usual, with just some players missing. It is a bizarro world of precarious ecosystems with entire parts missing, of still recovering geochemical cycles. Disaster taxa dominate, entire ranges of body size are gone, the atmosphere is still recovers. It is in that arena that the destinies of evolutionary lineages are played.  Take it after the Permian catastrophe:

Coral and metazoan reef systems were replaced by microbial carbonate mounds for up to six million years [16]. Key marine functional types including macroalgae, metazoan suspension feeders, mobile predators and deposit feeders were lost or rare for at least the first million years [16]. Complex burrowing of benthic sediments remained relatively rare for yet another ~4 million years […] In the aftermath of the PT extinction, certain
features were preserved in rocks that had not occurred since
abundant metazoans fully colonized the soft sediments of the
seafloor [55]. These features, and other anachronistic structures
[56], are important because they imply that certain ecological
strategies were so rare (or even absent) that they no longer
had a readily observable effect on ecosystems.

Something that comes up from different lines of evidence is that recovery is never a monolith: different environments and groups recover at different speed:

Although ammonites suffered very high levels
of extinction during the end-Permian, they diversified within
the first 2 million years after the extinction […] Benthic taxa, by contrast, generally took more than 5 million years to fully recover pre-extinction levels of diversity and community complexity […] Regardless of the cause, variation in diversification rates amongst taxa is typical of mass extinction aftermaths more generally. On land, some ecological strategies lost at the extinction boundary re evolved immediately while others, like small-bodied insectivory and large bodied herbivory, took more than 15 million years to reappear [64], resulting in distinct Early Triassic food-web structures in the meantime [65].

However there is an act of balance between the intrinsic factor, such as different competition or niches opening and closing, and instead extrinsic factors such as the quenching of volcanism after the main extinction event (Hull reminds that volcanic outgassing and anoxia were still present for millions of years in the Triassic), or the carbon cycle stabilization. Ammonite diversification in the Triassic seems coupled to the carbon cycle, for example. Post-extinction ecosystems seem weirdly unstable; for example various dynasties of dominance and decline follow each other for coccolithophores in the Paleocene, with no apparent reason.

Hull here posits a theory, that these two factors cannot be taken in isolation. Geochemistry affects ecosystems but ecosystems affect geochemistry as well:

On a global scale, the structure and function of ecosystems affects key earth-system processes, such as rates of weathering, soil formation, organic carbon sequestration, nutrient availability and recycling, and the availability of key substrates such as soils and reefs [78, 79, 80]. These processes move various elements between earth system reservoirs, for instance from the ocean to the atmosphere or from soils to streams. On a global scale, the time it takes for various elements to move, on average, between reservoirs can be quite long (100 years to 10 million years) [81]. As various earth-system reservoirs and fluxes change, they have the scope to, in turn, affect ecosystems on a global scale, because they alter the prevailing nutrient availability and environmental conditions

This reciprocal feedback results in what Hull calls earth system successions: not only biomes are different after mass extinctions, but the whole functioning of the planet. The extinction is thus followed by a state of instability while the systems comes back to a novel equilibrium. The waves of disaster ripple for millions of years before settling down.

Hull also reminds us that mass extinctions are not the only game in town when it comes to major evolutionary upheavals. The Paleocene-Eocene warming event was a minor extinction event but a major turnover in megafauna (modern whales and pinnipeds arise there). The rise of flower plants during the Cretaceous was a massive evolutionary event in the history of Earth but it did not follow any major extinction, as far as we know.

What Hull teaches us is that mass extinctions are not point events; they are ripples of enduring change that interweave with other ever changing conditions:

In the prolonged aftermath, ecosystem change across the globe exerts an evolutionary influence distinct from the extinction itself, with a timing characteristic of the earth system (i.e., earth system succession). As such, mass extinctions should not be considered as macroevolutionary point events, but rather as prolonged intervals of varying selection spanning the mass death and subsequent radiation of taxa.

A deep, sobering perspective. And I want also to note: I believe such insight can come only from the awe and respect Hull has for the monumental task of reconstructing Earth’s history, something that we should all consider. Speaking of the Permian:

“To step back for a moment, just consider how remarkable
this hypothesis is — to argue that we can trace the trigger of
mass extinction a quarter of billion years ago to a single pulse
of volcanism in Siberia and its cascade of environmental effects.
It is astounding and relies on dramatic improvements in our
ability to precisely date the geological time scale, to discern
the relative amount of time captured in very thin layers of rock
and to measure various aspects of the environment with
geochemistry.”

It is marvellous to live in the age of humanity when this history unfolds under our eyes.  To see such a majestic landscape in time and be moved by it, is what makes it possible for us to appreciate its complexity.

Paper: Hull, P. (2015). Life in the aftermath of mass extinctions. Current Biology25(19), R941-R952. https://doi.org/10.1016/j.cub.2015.08.053

Sick of biodiversity?

The new Chinese coronavirus is the current talk of the town. As for every emerging zoonotic disease, the relationship between environment exploitation, biodiversity and spillover casts its shadow. Therefore, just as a side note, I am driven to reread this review that appeared in December on Nature Ecology and Evolution. The main message is relatively technical, and it is that the relationship between biodiversity and disease is not linear, but depends on the geographics scale we’re looking at. But to my simple mind, a few words are useful as a remind of our grim, conflictual relationship with the living world: ecosystems are both richness and danger.

Ecosystems regularly pose a threat of disease to humans and wildlife,

Which does not mean that wiping out forests is a good way of managing zoonosis. On the contrary:

targeting conservation toward protecting ecosystems that are not currently posing a major threat of problematic disease to humans or wildlife might prevent increases in disease

and

preservation of intact, functioning ecosystems and finding sustainable, equitable interventions that discourage human incursions into those ecosystems (for example, for logging and bush-meat hunting), could reduce the risk of transmission of multiple pathogens, even if these interventions are not the single most efficient control method for individual diseases. Thus, they could represent win–win scenarios for conservation and disease control.

There is hope, then. But the whole review is interesting for whoever wants to see how little we know and how many the nuances. Ecosystems bring beauty and disaster. Despite what the term “ecosystem service” brings to mind, they’re not there to serve us. They are features of nature, and should be treated with the circumspection and respect this implies.

Charting the tides of life: a fine grained history of Paleozoic biodiversity

Is there a view grander than this?

We speak of evolution in the history of Earth, of the millions of years, of entire groups of living beings waxing and waning, but our view on the actual timeline has always been tragically blurry. Deep time does not let things escape its clutch with ease. Fossils are always few and far between, and we can never be certain of having sampled everything. If we see a fossil species popping out, say, 400 millions of years ago, who’s to say it was not there 450 millions of years ago too, but we didn’t find it? If we see it dying 300 millions of years ago, who’s to say it didn’t survive somewhere undocumented? (The formal term for all this is the Signor-Lipps effect) That is what happened to the coelacanth, for example: considered dead for 66 millions of years, until Marjorie Courtney-Latimer found a fresh one in a fish market.

But we slowly have more and more data, and we have more and more computer power to devise their meaning from sophisticated probabilistic model. That is what the breathtaking paper from Jun-xuan Fan et al. published on Science is all about. Using a huge amount of data on marine fossils from Chinese strata, spanning from 538.85 (Early Cambrian) up to 244.41 (Early Triassic), and processing it on one of the most powerful Chinese supercomputers, the Tianhe II, they managed to chart the rise and fall of marine biodiversity (pardon: marine mostly animal biodiversity: as usual non-animal groups are forgotten, fusulinids being an exception) in the Paleozoic, with a time resolution of about 26.000 years. Limiting to China is not a problem as big as it seems: today’s China is a puzzle of geological units that once span from North to South pole, all around the world.

It might seem that a resolution of 26.000 years is fuzzy -a ‘pixel’ of their timeline is almost four times longer than the history of civilization- but it’s geological time we are talking here. A span of 294 millions of years, the most recent 244.41 millions of years ago. Split into 11326 intervals. This is truly high resolution, and the result is magnificent.

Look at the image above. On top you see the global genus and species biodiversity (note the two different scales left and right), on the bottom the number of species split into different taxonomic categories. The coloured time intervals are  1, Great Ordovician Biodiversification Event; 2, end-Ordovican mass extinction; 3, early Silurian radiation; 4, Middle to Late Devonian diversity decline; 5, late Carboniferous–early Permian biodiversification event; 6, end-Permian mass extinction.

Extinctions happen on all variety of timescales. One plot, and we can finally end forever the war between ‘instant mass extinction’ catastrophism and Lyellian gradualism. There is, simply, a spectrum of all timescales. The razor-sharp vertical cliff at the end of Permian is clearly visible: in a few tens of thousands years, life on Earth was all but wiped out. On the other hand, in the Devonian the number of animal species halved slowly but steadily between about 400 to 370 millions of years ago, and only started to recover about 330 millions of years ago. Is that a mass extinction, only as long as the time interval separating us from the dinosaurs? How do we conceptualize this sluggish but constant loss of biological diversity? Recovery events are also variable: sometimes biodiversity immediately bounces after a decline, sometimes there are millions of years of stasis before life diversifies again.

It is also interesting to my former-scientist eye how many phenomena we believed in, such as the end-Guadalupian extinction, could have been nothing more than artifacts. Past charts of biodiversity history were much more coarse grained, and counted genera and families into million years-long bins. A poorly appreciated fact is that lowering the resolution does not only hide details, it also creates false details, by lumping and restructuring the information. The illusory canals on Mars appeared to XIX-early XX century observers due exactly to that.

We often imagine paleontology as a single-fossil discipline. One digs and finds an Archaeopteryx, a Sinosauropteryx, a Taung Child, a Hallucigenia, a key set of bones and stones that makes or breaks an evolutionary hypothesis. Sometimes it is true, but to appreciate the river of life, one must look beyond the individual drops that make it. Palaeontology is a lot about statistics, and it is amazing how the progress in searching, cataloging and analyzing big data on past biodiversity is yielding a picture of our complex past.

Ernst Rutherford (maybe) said that science is either physics or stamp collecting. I hope it was just a silly joke; a stupider take on science is hard to find. Here we see the epitome of stamp collecting: thousands of shells, traces on rocks, legs, bones being lovingly removed from their hundred-of-million-years graves, described and pinpointed on the history of life. The result is nothing less than the irregular heartbeat of the tides of life, the endless tree of forms growing and wilting, under ever diverse, endless forces, in a time incomprehensibly long and remote, and yet no less real.

The paper is: Fan, Jun-Xuan et al. A high-resolution summary of Cambrian to Early Triassic marine invertebrate biodiversity Science, 17 Jan 2020 : 272-277

(Also read the Perspectives on Science and Nature)